Source Institutions
Source Institutions
Add to list Go to activity
Activity link broken? See if it's at the internet archive
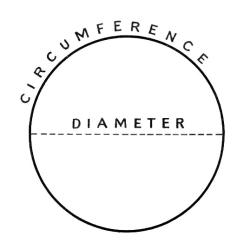
In this activity, learners use a straight line to learn about circles. Learners measure and record the diameter and circumference of different sized cylindrical objects on a chart. Learners then plot the diameters and circumferences on a graph and calculate the slope to discover the linear relationship between the two proprieties.
- Under 5 minutes
- 30 to 45 minutes
- $1 - $5 per group of students
- Ages 11 - 18
- Activity
- English
Quick Guide
Materials List (per group of students)
- cylindrical objects of different sizes
- string
- ruler
- graph paper
- large piece of graph paper to collect group data (optional)
Subjects
-
Mathematics
-
Algebra
- Equations and Inequalities
- Patterns
- Variables and Expressions
-
Data Analysis and Probability
- Data Analysis
- Data Collection
- Data Representation
-
Geometry
- Solid Geometry
-
Measurement
- Units of Measurement
- Size and Scale
- Circles
- Rate
-
Number and Operations
- Decimals
- Representation
-
Algebra
-
The Nature of Science
-
The Scientific Process
- Conducting Investigations
- Gathering Data
- Formulating Explanations
- Communicating Results
-
The Scientific Process
Audience
To use this activity, learners need to:
- see
- read
- touch
Learning styles supported:
- Involves hands-on or lab activities
Other
This resource is part of:
Access Rights:
- Free access
By:
- Yu, Julie
Rights:
- All rights reserved, Exploratorium, 2008
Funding Sources:
- National Science Foundation, 0610238
- National Science Foundation, 0925383