Search Results
Showing results 1 to 7 of 7

The Scoop on Scallops
Source Institutions
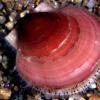
In this data analysis activity, learners quantify the abundance and distribution of sea scallops in and adjacent to the Mid-Atlantic closed areas.

Create a Pasta Population Map
Source Institutions
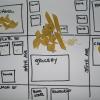
Learners work as a group to create a map of their community. They use pasta to represent people, and glue the pasta on their maps to show areas of large population.
The Blue Crab's Chesapeake Journey
Source Institutions
In this data collection activity about crabs, learners use data from the Virginia Institute of Marine Science (VIMS) trawl survey to determine the areas of the Chesapeake Bay that are being used by bl

Bugs, Worms & Others
Source Institutions
In this creative outdoor activity, learners invent populations of make-believe organisms and then investigate real populations living in the activity site.

Energy Use in the Americas
Source Institutions
Learners explore the relationship between energy consumption, population, and carbon emissions in the countries of the Americas.

Whatta Web
Source Institutions
In this activity, learners play a game to simulate the food chain.

Shake a Shrub
Source Institutions
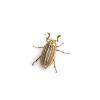
This is an activity where learners will discover what types and how many insects live in their own backyard.
