Source Institutions
Source Institutions
Add to list Go to activity
Activity link broken? See if it's at the internet archive
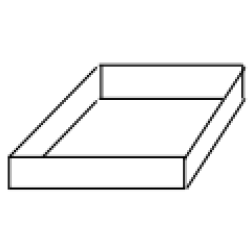
In this math lesson, learners explore polynomial and rational function patterns. Learners investigate the relationships between the x-intercepts, factors, and roots of polynomial functions using a graphing calculator. Learners also explore rational functions, identifying the roots, asymptotes, and holes in graphs. Finally, learners construct boxes of various dimensions using graphing paper. Learners use the height and volume data from these boxes to create a scatterplot in order to determine the height of the box with the maximum volume.
- Under 5 minutes
- 45 to 60 minutes
- 1 cent - $1 per group of students
- Ages 14 - 18
- Activity, Lesson/Lesson Plan
- English
Quick Guide
Materials List (per group of students)
- Graphing calculator with overhead unit
- Overhead projector
- Graph paper
- Scotch tape
- Scissors
- Markers
- Polynomial Functions activity sheet
- Rational Functions activity sheet
- The Box Problem activity sheet
Subjects
-
Mathematics
-
Algebra
- Equations and Inequalities
- Patterns
- Variables and Expressions
-
Data Analysis and Probability
- Data Analysis
- Data Collection
- Data Representation
- Measurement
-
Number and Operations
- Multiples and Factors
- Reasoning and Proof
- Representation
-
Algebra
-
The Nature of Technology
-
The Design Process
- Problem Solving
-
The Design Process
-
Physical Sciences
-
Structure and Properties of Matter
- Volume and Density
-
Structure and Properties of Matter
Audience
To use this activity, learners need to:
- see
- read
- touch
Learning styles supported:
- Involves teamwork and communication skills
- Involves hands-on or lab activities
Other
This resource is part of:
Access Rights:
- Free access
By:
Rights:
- All rights reserved, PBS, 2012
Funding Source:
- US Department of Education