Search Results
Showing results 1 to 20 of 39

Heavy Air
Source Institutions
In this activity and/or demonstration, learners illustrate visually and physically that air has weight. Learners balance two equally-inflated balloons hanging from string on a yard stick.

If Hot Air Rises, Why is it Cold in the Mountains?
Source Institutions
This demonstration/activity helps learners understand why higher elevations are not always warm simply because "hot air rises." Learners use a tire pump to increase the pressure and temperature inside
A Recipe for Air
Learners use M&Ms® (or any other multi-color, equally-sized small candy or pieces) to create a pie graph that expresses the composition of air.

I Can't Take the Pressure!
Learners develop an understanding of air pressure in two different activities.
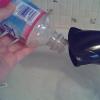
Air Pressure
Source Institutions
In this experiment, learners use a blow dryer and water bottle to observe and record changes in air pressure caused by changes in temperature.

Go with the Flow
Source Institutions
In this quick and easy activity and/or demonstration, learners use two empty soda cans to illustrate Bernoulli's principle.

Pollution Patrol
Source Institutions
In this activity, learners explore how engineers design devices that can detect the presence of pollutants in the air.

A Pressing Engagement
Source Institutions
In this quick and easy activity and/or demonstration, learners illustrate the effect of the weight of air over our heads.
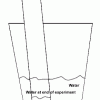
Percentage of Oxygen in the Air
Source Institutions
In this activity, learners calculate the percentage of oxygen in the atmosphere by using steel wool's ability to rust.

Heat Capacity: Can't Take the Heat?
Source Institutions
Why is ocean water sometimes the warmest when the average daily air temperature starts to drop? In this activity, learners explore the differing heat capacities of water and air using real data.
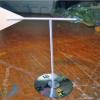
Weather Vane
Source Institutions
In this meteorology activity, learners build weather vanes using straws, paperclips, and cardstock.

Air Cannon
Source Institutions
In this activity (page 1 of PDF under SciGirls Activity: Forecasting), learners will construct an air cannon by cutting a hole in the bottom of a bucket and stretching a garbage bag over the other end
Crunch Time
Source Institutions
In this quick and easy activity and/or demonstration, learners use two empty 2-liter bottles and hot tap water to illustrate the effect of heat on pressure.
Weather Vane and Anemometer
Source Institutions
In this meteorology activity, learners construct simple devices to measure the direction and speed of wind.
Measure the Pressure: The "Wet" Barometer
Source Institutions
In this activity, learners use simple items to construct a device for indicating air pressure changes.
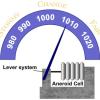
Measure the Pressure II: The "Dry" Barometer
Source Institutions
In this activity, learners use simple items to construct a device for indicating air pressure changes.

Fog Chamber
Source Institutions
In this weather-related activity, learners make a portable cloud in a bottle.

Draft Detectives
Source Institutions
In this two part activity, learners become draft detectives by constructing their own draft catchers to detect drafts around windows or doors.

That Sinking Feeling
Source Institutions
In this quick activity, learners observe how salinity and temperature affect the density of water, to better understand the Great Ocean Conveyor.

Drawing Conclusions
Source Institutions
In this weather forecasting activity, learners determine the location of cold and warm fronts on weather plot maps.
