Search Results
Showing results 1 to 3 of 3

Mapping Greenhouse Gas Emissions Where You Live
Source Institutions
In this lesson plan, learners examine some of the of greenhouse gas emissions sources in their community.
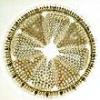
Diatom Ooze: Ooze Clues
Source Institutions
In this activity, learners will plot the distribution of various oozes using information from sediment maps.
Energy Audit
Source Institutions
In this lesson, learners will practice graphing and statistically analyzing data.