Search Results
Showing results 1 to 10 of 10
Why Doesn’t the Ocean Freeze?
Source Institutions
In this activity, learners explore how salt water freezes in comparison to fresh water.
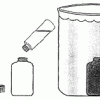
Make Your Own Deep-Sea Vent
Source Institutions
In this activity, learners make a model of the hot water of a deep sea vent in the cold water of the ocean to learn about one of the ocean's most amazing and bizarre underwater habitats.

Slowing the Flow
Source Institutions
In this experiment, pairs of learners explore how cold water affects circulation. The mammalian diving reflex (MDR) slows circulation when the body is exposed to cold water.
Crunch Time
Source Institutions
In this quick and easy activity and/or demonstration, learners use two empty 2-liter bottles and hot tap water to illustrate the effect of heat on pressure.
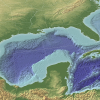
The Dead Zone: A Marine Horror Story
Source Institutions
In this environmental science and data analysis activity, learners work in groups to track a Dead Zone (decreased dissolved oxygen content of a body of water) using water quality data from the Nutrien
How Animals Stay Warm
Source Institutions
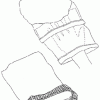
In this quick activity, learners explore how blubber protects animals from the cold by making a "blubber mitt." Using cooking shortening, two zip-top sandwich bags, and duct tape, learners simulate bl

Rubber Blubber Gloves
Source Institutions
In this experiment, learners work in pairs to create two gloves -- one that contains a layer of shortening (blubber) inside, and one that doesn't.

Avogadro's Bubbly Adventure
Source Institutions
In this activity on page 7 of the PDF, learners investigate the solubility of gas in water at different temperatures. This experiment will help learners determine if temperature affects solubility.
Fish Eyes: More than Meets the Eye
Source Institutions
In this data collection and analysis activity, learners evaluate fish physiology and ecology using vision research data from Dr.
Coral, Carbon Dioxide and Calcification
Source Institutions
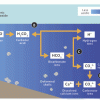
In this group activity, learners act out key stages of the "ocean carbon cycle" (also known as the "carbonate buffer system") through motions, rearranging blocks and team tasks.
