Search Results
Showing results 1 to 20 of 38

A Funny Taste
Source Institutions
In this activity, learners explore the different salinities of various sources of water by taste-testing.

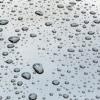
How Much Water is in that Cloud?
Source Institutions
In this activity, learners working in pairs saturate a cotton ball using water drops from an eyedropper to demonstrate the high water capacity of clouds.

The Rumblin' Road: Determining distance to a Thunderstorm
Source Institutions
In this activity, learners discover how to determine the distance to a lightning strike or nearby thunderstorm.
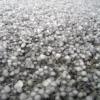
Sizing Up Hail
Source Institutions
In this activity, learners will estimate the sizes of balls to learn how to estimate the size of hail. Learners will compare their estimates to the estimates of their peers and the real measurements.

Quadraphonic Wind
Source Institutions
In this activity, learners discover how the extent of various wind speeds changes in each of the four quadrants around a hurricane.

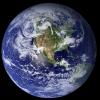
Earth's Energy Cycle: Albedo
Source Institutions
In this activity, learners experiment and observe how the color of materials that cover the Earth affects the amounts of sunlight our planet absorbs.
Atmospheric Collisions
Source Institutions
In this activity/demonstration, learners observe what happens when two ping pong balls are suspended in the air by a hair dryer. Use this activity to demonstrate how rain drops grow by coalescence.
Trees: Recorders of Climate Change
Source Institutions
In this activity, learners are introduced to tree rings by examining a cross section of a tree, also known as a “tree cookie.” They discover how tree age can be determined by studying the rings and ho
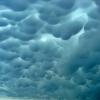
Head in the Clouds
Source Institutions
In this activity, learners create a CloudSpotter wheel and record the different types of clouds they observe twice daily over several days.
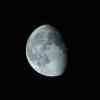
Moonlight Serenade
Source Institutions
In this activity, learners act as the Earth and observe how different angles between the Sun, Earth, and Moon affect the phases of the moon we see each month.
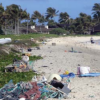
A Scientific Cleanup
Source Institutions
This is a comprehensive lesson plan on page 85 for a group cleanup trip to a local beach, lake or stream. Learners keep track of the types and amounts of trash picked up and analyze this information.
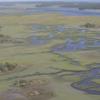
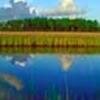
Nutrients in an Estuary
Source Institutions
In this activity, learners model estuaries, artificially enriching both fresh and salt water samples with different amounts of nutrients and observing the growth of algae over several weeks.
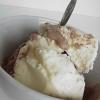
We all Scream for Ice Cream
Source Institutions
In this activity, learners observe how salinity affects the freezing point of water by making and enjoying ice cream.

It's the "Rain," Man
Source Institutions
In this weather forecasting activity, learners use common materials to construct a rain gauge and measure daily, monthly, and yearly rainfall.
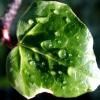
Leaf it to Me
Source Institutions
In this activity, learners observe the effect of transpiration as water is moved from the ground to the atmosphere.

The Shadow Knows I
Source Institutions
In this activity, learners will measure the length of their shadow from the Sun and compare it three to four months later.

Drawing Conclusions
Source Institutions
In this weather forecasting activity, learners determine the location of cold and warm fronts on weather plot maps.
Human Impact on Estuaries: A Terrible Spill in Grand Bay
Source Institutions
In this activity, learners make a model of a pollution spill that occurred at Bangs Lake in Mississippi and measure water quality parameters in their model.
The Shadow Knows II
Source Institutions
In this activity, learners will measure the length of a shadow and use the distance from the equator to calculate the circumference of the earth.

A Degrading Experience
Source Institutions
In this activity on page 27, learners perform an experiment to learn about how different types of marine debris degrade and how weather and sunlight affect the rate of degradation.