Search Results
Showing results 1 to 16 of 16

A Funny Taste
Source Institutions
In this activity, learners explore the different salinities of various sources of water by taste-testing.
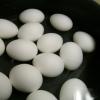
Salt 'n Lighter
Source Institutions
In this activity, learners discover that as the salinity of water increases, the density increases as well. Learners prove this by attempting to float fresh eggs in saltwater and freshwater.
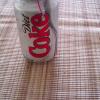
Diet Light
Source Institutions
In this quick activity, learners observe how the added sugar in a can of soda affects its density and thus, its ability to float in water.

The Carbon Cycle and its Role in Climate Change: Activity 3
Source Institutions
In this activity, learners explore the human influences on the carbon cycle and examine how fossil fuels release carbon.
Coral, Carbon Dioxide and Calcification
Source Institutions
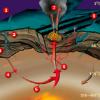
In this group activity, learners act out key stages of the "ocean carbon cycle" (also known as the "carbonate buffer system") through motions, rearranging blocks and team tasks.
The Carbon Cycle and its Role in Climate Change: Activity 1
Source Institutions
In this activity (on page 1), learners role play as atoms to explore how atoms can be rearranged to make different materials.
The Carbon Cycle and its Role in Climate Change: Activity 2
Source Institutions
In this activity (on page 7), learners explore the meaning of a "carbon sink." Using simple props, learners and/or an educator demonstrate how plants act as carbon sinks and how greenhouse gases cause
Candy Chemosynthesis
Source Institutions
In this activity, groups of learners work together to create edible models of chemicals involved in autotrophic nutrition.
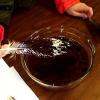
We all Scream for Ice Cream
Source Institutions
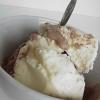
In this activity, learners observe how salinity affects the freezing point of water by making and enjoying ice cream.
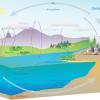
The Carbon Cycle: How It Works
Source Institutions
In this game, learners walk through an imaginary Carbon Cycle and explore the ways in which carbon is stored in reservoirs and the processes that transport the carbon atom from one location to another

That Sinking Feeling
Source Institutions
In this quick activity, learners observe how salinity and temperature affect the density of water, to better understand the Great Ocean Conveyor.
The Carbon Cycle: Carbon Tracker
Source Institutions
In this activity, learners play NOAA's Carbon Tracker game and discover ways to keep track of carbon dioxide and other greenhouse gases in the world.
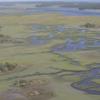
Nutrients in an Estuary
Source Institutions
In this activity, learners model estuaries, artificially enriching both fresh and salt water samples with different amounts of nutrients and observing the growth of algae over several weeks.
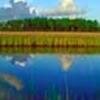
Human Impact on Estuaries: A Terrible Spill in Grand Bay
Source Institutions
In this activity, learners make a model of a pollution spill that occurred at Bangs Lake in Mississippi and measure water quality parameters in their model.
Find the Best Way to Clean Oil off Bird Feathers
Source Institutions
In this experiment, learners examine the way oil affects bird feathers and test different cleanup methods to find out which works best.
Off Base
Source Institutions
In this activity, learners explore the factors that tend to resist changes in pH of the ocean and why the ocean is becoming more acidic.