Search Results
Showing results 1 to 20 of 32

A Funny Taste
Source Institutions
In this activity, learners explore the different salinities of various sources of water by taste-testing.

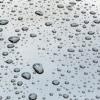
How Much Water is in that Cloud?
Source Institutions
In this activity, learners working in pairs saturate a cotton ball using water drops from an eyedropper to demonstrate the high water capacity of clouds.
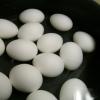
Salt 'n Lighter
Source Institutions
In this activity, learners discover that as the salinity of water increases, the density increases as well. Learners prove this by attempting to float fresh eggs in saltwater and freshwater.
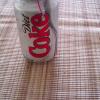
Diet Light
Source Institutions
In this quick activity, learners observe how the added sugar in a can of soda affects its density and thus, its ability to float in water.
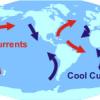
How it is Currently Done
Source Institutions
In this quick activity, learners observe how wind creates ocean currents.
Atmospheric Collisions
Source Institutions
In this activity/demonstration, learners observe what happens when two ping pong balls are suspended in the air by a hair dryer. Use this activity to demonstrate how rain drops grow by coalescence.
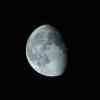
Moonlight Serenade
Source Institutions
In this activity, learners act as the Earth and observe how different angles between the Sun, Earth, and Moon affect the phases of the moon we see each month.
Updrafts in Action
Source Institutions
In this weather activity/demonstration, learners watch as a ping pong ball is suspended in a stream of air supplied by a hair dryer.
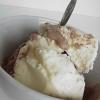
We all Scream for Ice Cream
Source Institutions
In this activity, learners observe how salinity affects the freezing point of water by making and enjoying ice cream.

It's the "Rain," Man
Source Institutions
In this weather forecasting activity, learners use common materials to construct a rain gauge and measure daily, monthly, and yearly rainfall.
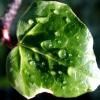
Leaf it to Me
Source Institutions
In this activity, learners observe the effect of transpiration as water is moved from the ground to the atmosphere.

The Shadow Knows I
Source Institutions
In this activity, learners will measure the length of their shadow from the Sun and compare it three to four months later.

Drawing Conclusions
Source Institutions
In this weather forecasting activity, learners determine the location of cold and warm fronts on weather plot maps.
The Shadow Knows II
Source Institutions
In this activity, learners will measure the length of a shadow and use the distance from the equator to calculate the circumference of the earth.
Toasty Wind
Source Institutions
In this quick activity, learners use a toaster to investigate the source for the Earth's wind. Learners hold a pinwheel above a toaster to discover that rising heat causes wind.
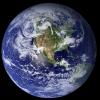
Water, Water Everywhere
Source Institutions
In this activity, learners estimate how much water they think can be found in various locations on the Earth in all its states (solid, liquid, and gas) to discover the different water ratios in the Ea
A Pressing Engagement
Source Institutions
In this quick and easy activity and/or demonstration, learners illustrate the effect of the weight of air over our heads.

The Daily Ups and Downs
Source Institutions
In this activity, learners graph 48 hourly air temperatures from a local weather observation site and observe the diurnal temperature variations.

Go with the Flow
Source Institutions
In this quick and easy activity and/or demonstration, learners use two empty soda cans to illustrate Bernoulli's principle.
Modeling Tidal Action
Source Institutions
In this activity (Lesson 1), learners work in groups to create tide simulations.