Search Results
Showing results 1 to 4 of 4

The Missing Link
Source Institutions
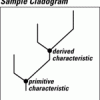
In this activity, learners collect, analyze, and interpret information about objects in order to classify them into a cladogram. Use this activity to talk about how scientists classify things.

Dogs and More Dogs
Source Institutions
In this activity, learners play an evolution card game to see how selective pressures can affect an organism's evolution.

Statistics: Steppin' Out
Source Institutions
In this math lesson, learners construct box-and-whisker plots to analyze and compare data sets. Learners investigate whether or not long-legged people run faster than short-legged people.

Statistics: Something Fishy
Source Institutions
In this math lesson, learners apply the concepts of ratio and proportion to the capture-recapture statistical procedure.
