Search Results
Showing results 1 to 6 of 6

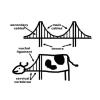
Energy Use in the Americas
Source Institutions
Learners explore the relationship between energy consumption, population, and carbon emissions in the countries of the Americas.

Heat Capacity: Can't Take the Heat?
Source Institutions
Why is ocean water sometimes the warmest when the average daily air temperature starts to drop? In this activity, learners explore the differing heat capacities of water and air using real data.
Coastal Erosion: Where's the Beach?
Source Institutions
Learners use beach profile data from a local beach or online data from Ocean City, Maryland to investigate coastal erosion and sediment transport.
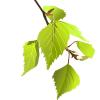
Exercise in Creating Drawings for Field Notebooks
Source Institutions
Learners draw and describe a leaf, and then re-find leaves drawn and described by other learners. Learners can observe leaves outside, or leaves may be brought into the classroom.
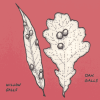
Swell Homes
Source Institutions
In this outdoor activity, learners find the swollen bumps known as "galls" on various plants and get a closeup look at the parasitic animals living inside.
Scientific Measurement Exercise
Source Institutions
Learners measure irregularly shaped bones using a variety of measurement methods and tools. Then, they measure again using standard conventions and metric tape measures.