Search Results
Showing results 1 to 20 of 250
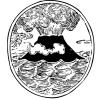
Lava Layering: Making and Mapping a Volcano
Source Institutions
In this activity, learners discover how geologists use stratigraphy, the study of layered rock, to understand the sequence of geological events.
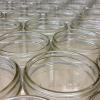
Hot Stuff!: Investigation #4
Learners test two jars containing soil, one covered and one open, for changes in temperature. After placing the jars in the Sun, learners discover that the covered jar cools down more slowly.

Dripping Wet or Dry as a Bone?
Learners investigate the concept of humidity by using a dry and wet sponge as a model. They determine a model for 100% humidity, a sponge saturated with water.
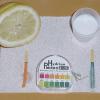
Acid (and Base) Rainbows
Learners use red cabbage juice and pH indicator paper to test the acidity and basicity of household materials. The activity links this concept of acids and bases to acid rain and other pollutants.
Hot Stuff!: Investigation #1
Learners test two jars, one containing plain air and one containing carbon dioxide gas, to see their reactions to temperature changes.
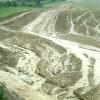
Identifying Erosion
Source Institutions
In this environmental science activity (page 3 of the PDF), leaners will identify and explain the causes of erosion.
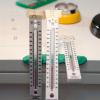
Hot Equator, Cold Poles
Source Institutions
In this activity, learners use multiple thermometers, placed at different angles, and a lamp to investigate why some places on Earth's surface are much hotter than others.
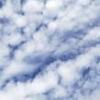
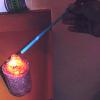
Clues About Clouds
Source Institutions
In this weather activity which requires adult supervision, learners will get a chance to make a cloud right here on Earth!
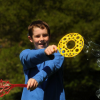
Wind Mapping with Bubbles
Source Institutions
Discover the wind's direction using bubbles, a map and a keen eye. Learners blow bubbles and note their general direction on a map, taking readings from different points around a building.
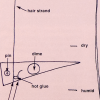
Better Hair Through Chemistry
Source Institutions
In this activity, learners hook up a hair to a lever system and create a hair hygrometer to measure changes in humidity.

A Funny Taste
Source Institutions
In this activity, learners explore the different salinities of various sources of water by taste-testing.

How Much Water is in that Cloud?
Source Institutions
In this activity, learners working in pairs saturate a cotton ball using water drops from an eyedropper to demonstrate the high water capacity of clouds.
Glaciers
Source Institutions
In this online activity, learners adjust mountain snowfall and temperature to see how glaciers grow and shrink. They will use scientific tools to measure thickness, velocity and glacial budget.

The Rumblin' Road: Determining distance to a Thunderstorm
Source Institutions
In this activity, learners discover how to determine the distance to a lightning strike or nearby thunderstorm.
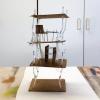
Engineering For Earthquakes
Source Institutions
In this design challenge, learners will engineer a structure and see if it can survive an earthquake they create.
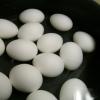
Salt 'n Lighter
Source Institutions
In this activity, learners discover that as the salinity of water increases, the density increases as well. Learners prove this by attempting to float fresh eggs in saltwater and freshwater.
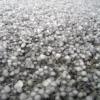
Sizing Up Hail
Source Institutions
In this activity, learners will estimate the sizes of balls to learn how to estimate the size of hail. Learners will compare their estimates to the estimates of their peers and the real measurements.
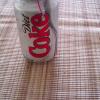
Diet Light
Source Institutions
In this quick activity, learners observe how the added sugar in a can of soda affects its density and thus, its ability to float in water.
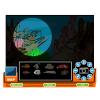
Underwater ROV
Source Institutions
In this online Flash game, learners will explore a coral reef using an underwater remotely operated vehicle (ROV).
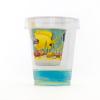
Ocean Acidification in a Cup
Source Institutions
Ocean acidification is a problem that humans will have to deal with as we release more and more carbon dioxide into the atmosphere.