Search Results
Showing results 1 to 7 of 7
Sea State: Forecast Conditions at Sea
Source Institutions
In this oceanography and data collection activity, learners cast real time sea state conditions using buoys from NOAA's National Data Buoy Center.

Percentage of Oxygen in the Air
Source Institutions
In this activity, learners calculate the percentage of oxygen in the atmosphere by using steel wool's ability to rust.
Weather Stations: Temperature and Pressure
Source Institutions
In this activity, learners discover the relationship between temperature and pressure in the lower atmospheres of Jupiter and Earth.
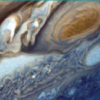
Weather Stations: Storms
Source Institutions
In this activity, learners test how cornstarch and glitter in water move when disturbed. Learners compare their observations with videos of Jupiter's and Earth's storm movements.

Drawing Conclusions
Source Institutions
In this weather forecasting activity, learners determine the location of cold and warm fronts on weather plot maps.
Weather Stations: Winds
Source Institutions
In this activity, learners use a toaster to generate wind and compare the appliance's heat source to Jupiter's own hot interior. Learners discover that convection drives wind on Jupiter and on Earth.
I Can't Take the Pressure!
Learners develop an understanding of air pressure in two different activities.