Search Results
Showing results 1 to 20 of 26

Earth's Energy Cycle: Albedo
Source Institutions
In this activity, learners experiment and observe how the color of materials that cover the Earth affects the amounts of sunlight our planet absorbs.
Glue Stick Sunset
Source Institutions
In this activity, learners explore why the sky is blue. Learners model the scattering of light by the atmosphere, which creates the blue sky and red sunset, using a flashlight and clear glue sticks.

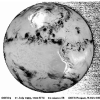
Arctic Sea Ice
Source Institutions
In this activity, learners explore how the area of Arctic sea ice has changed over recent years. First, learners graph the area of Arctic sea ice over time from 1979 to 2007.

It's a Gas, Man
Source Institutions
In this activity, learners discover if carbon dioxide has an effect on temperature.
Sea State: Forecast Conditions at Sea
Source Institutions
In this oceanography and data collection activity, learners cast real time sea state conditions using buoys from NOAA's National Data Buoy Center.

Percentage of Oxygen in the Air
Source Institutions
In this activity, learners calculate the percentage of oxygen in the atmosphere by using steel wool's ability to rust.
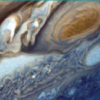
Weather Stations: Temperature and Pressure
Source Institutions
In this activity, learners discover the relationship between temperature and pressure in the lower atmospheres of Jupiter and Earth.
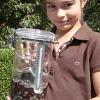
Carbon Dioxide Removal
Source Institutions
In this experiment using sprigs of Elodea, learners will observe a natural process that removes carbon dioxide (CO2) from Earth's atmosphere.
Weather Stations: Phase Change
Source Institutions
In this activity, learners observe the water cycle in action! Water vapor in a tumbler condenses on chilled aluminum foil — producing the liquid form of water familiar to us as rain and dew.
Make a Terrarium
Source Institutions
In this activity, learners make a miniature greenhouse or "terrarium" to explore the greenhouse effect.
Weather Stations: Storms
Source Institutions
In this activity, learners test how cornstarch and glitter in water move when disturbed. Learners compare their observations with videos of Jupiter's and Earth's storm movements.

What does Color have to do with Cooling?
Source Institutions
In this demonstration/experiment, learners discover that different colors and materials (metals, fabrics, paints) radiate different amounts of energy and therefore, cool at different rates.
How does the Atmosphere keep the Earth Warmer?
Source Institutions
In this activity, learners simulate the energy transfer between the earth and space by using the light from a desk lamp desk lamp with an incandescent bulb and a stack of glass plates.

The Daily Ups and Downs
Source Institutions
In this activity, learners graph 48 hourly air temperatures from a local weather observation site and observe the diurnal temperature variations.

Earth Atmosphere Composition
Source Institutions
In this activity, learners use rice grains to model the composition of the atmosphere of the Earth today and in 1880. Learners assemble the model while measuring percentages.
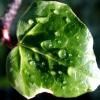
Leaf it to Me
Source Institutions
In this activity, learners observe the effect of transpiration as water is moved from the ground to the atmosphere.
How Greenhouse Gases Absorb Heat
Source Institutions
Learners observe two model atmospheres -- one with normal atmospheric composition and another with an elevated concentration of carbon dioxide.
Atmosphere Composition Model
Source Institutions
In this activity, learners create a model using metric measuring tapes and atmosphere composition data.

Drawing Conclusions
Source Institutions
In this weather forecasting activity, learners determine the location of cold and warm fronts on weather plot maps.
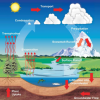
The Rain Man
Source Institutions
In this activity, learners observe the hydrologic cycle in action as water evaporates and condenses to form rain right before their eyes.