Search Results
Showing results 1 to 20 of 65

How Much Water is in that Cloud?
Source Institutions
In this activity, learners working in pairs saturate a cotton ball using water drops from an eyedropper to demonstrate the high water capacity of clouds.
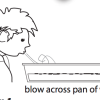
Blowin’ Up a Storm of Oil
Source Institutions
In this activity, learners investigate how wind can create surface currents and how waves move. Learners also discover how wind can affect oil spills.
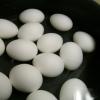
Salt 'n Lighter
Source Institutions
In this activity, learners discover that as the salinity of water increases, the density increases as well. Learners prove this by attempting to float fresh eggs in saltwater and freshwater.
Investigating Density Currents
Source Institutions
In this lab activity, learners explore how to initiate a density current. Learners measure six flasks with different concentrations of salt and water (colored blue).

Carbon Sequestration
Source Institutions
In this inquiry-based lesson, learners measure the biomass of trees, calculate the carbon stored by the trees, and use this information to create recommendations about using trees for carbon sequestra
Earth's Energy Cycle: Albedo
Source Institutions
In this activity, learners experiment and observe how the color of materials that cover the Earth affects the amounts of sunlight our planet absorbs.
Why Doesn’t the Ocean Freeze?
Source Institutions
In this activity, learners explore how salt water freezes in comparison to fresh water.
What Causes Rainbows?
Source Institutions
In this activity, learners explore how and why rainbows form by creating rainbows in a variety of ways using simple materials. Learners create rainbows indoors and outdoors.
How to View a Solar Eclipse
Source Institutions
This is an activity to do when there is a solar eclipse!
Understanding Albedo
Source Institutions
In this activity related to climate change, learners examine albedo and the ice albedo feedback effect as it relates to snow, ice, and the likely results of reduced snow and ice cover on global temper
My Angle on Cooling: Effects of Distance and Inclination
Source Institutions
In this activity, learners discover that one way to cool an object in the presence of a heat source is to increase the distance from it or change the angle at which it is faced.
Amphibian Skin
Source Institutions
In this activity, learners explore the concept of permeability to better understand why amphibians are extremely sensitive to pollution.
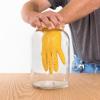
Fog Chamber
Source Institutions
In this weather-related activity, learners make a portable cloud in a bottle.
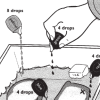
Spill Spread
Source Institutions
In this simulation, learners explore how ocean currents spread all kinds of pollution—including oil spills, sewage, pesticides and factory waste—far beyond where the pollution originates.
It's the "Rain," Man
Source Institutions
In this weather forecasting activity, learners use common materials to construct a rain gauge and measure daily, monthly, and yearly rainfall.

That Sinking Feeling
Source Institutions
In this quick activity, learners observe how salinity and temperature affect the density of water, to better understand the Great Ocean Conveyor.
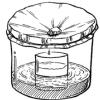
Rain Machine (Solar Still)
Source Institutions
In this activity, learners work in groups to build simple solar stills filled with salt water. After the stills are complete, learners observe what happens when they place the stills in the sun.
Leaf it to Me
Source Institutions
In this activity, learners observe the effect of transpiration as water is moved from the ground to the atmosphere.
Investigating Convection
Source Institutions
This experiment is designed to illustrate how fluids, including water, have the ability to flow.
Why is the Sky Blue?
Source Institutions
In this activity, learners create a "mini sky" in a glass of water in a dark room.
