Search Results
Showing results 1 to 20 of 25

Earth's Energy Cycle: Albedo
Source Institutions
In this activity, learners experiment and observe how the color of materials that cover the Earth affects the amounts of sunlight our planet absorbs.
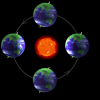
The Four Seasons
Source Institutions
In this lesson that includes hands-on activities and demonstrations, learners discover that it is the tilt of the Earth's axis (not its proximity to the sun) that causes the seasons.
Coastal Erosion: Where's the Beach?
Source Institutions
Learners use beach profile data from a local beach or online data from Ocean City, Maryland to investigate coastal erosion and sediment transport.
Sea State: Forecast Conditions at Sea
Source Institutions
In this oceanography and data collection activity, learners cast real time sea state conditions using buoys from NOAA's National Data Buoy Center.
My Angle on Cooling: Effects of Distance and Inclination
Source Institutions
In this activity, learners discover that one way to cool an object in the presence of a heat source is to increase the distance from it or change the angle at which it is faced.
Weather Stations: Temperature and Pressure
Source Institutions
In this activity, learners discover the relationship between temperature and pressure in the lower atmospheres of Jupiter and Earth.
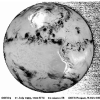
Understanding Albedo
Source Institutions
In this activity related to climate change, learners examine albedo and the ice albedo feedback effect as it relates to snow, ice, and the likely results of reduced snow and ice cover on global temper
Weather Stations: Phase Change
Source Institutions
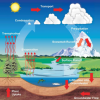
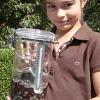
In this activity, learners observe the water cycle in action! Water vapor in a tumbler condenses on chilled aluminum foil — producing the liquid form of water familiar to us as rain and dew.
Make a Terrarium
Source Institutions
In this activity, learners make a miniature greenhouse or "terrarium" to explore the greenhouse effect.
Effects of Solar Radiation on Land and Sea
Source Institutions
In this activity, learners explore the different heating properties of soil and water.
The Shadow Knows II
Source Institutions
In this activity, learners will measure the length of a shadow and use the distance from the equator to calculate the circumference of the earth.

What Causes Wind?
Source Institutions
In this sunny day experiment, learners measure and compare how quickly light and dark colored materials absorb heat.
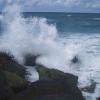
Waves and Tides
Source Institutions
In this 7-10 day investigation, learners develop an understanding of waves and tides and their motion through discussion, demonstration, and hands-on activities.
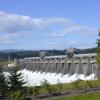
The Best Dam Simulation Ever
Source Institutions
This online simulation game explores the different consequences of water levels on the Columbia River in the Pacific Northwest.
Modeling Tidal Action
Source Institutions
In this activity (Lesson 1), learners work in groups to create tide simulations.
How does the Atmosphere keep the Earth Warmer?
Source Institutions
In this activity, learners simulate the energy transfer between the earth and space by using the light from a desk lamp desk lamp with an incandescent bulb and a stack of glass plates.
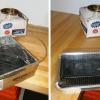
Solar Water Heater
Learners work in teams to design and build solar water heating devices that mimic those used in residences to capture energy in the form of solar radiation and convert it to thermal energy.
House Warming
Source Institutions
In this physical sciences activity, learners explore how passive solar design increases energy efficiency.
The Return of El Nino
Source Institutions
In this activity related to climate change and data analysis, learners examine temperature and precipitation data to determine if climate variations are due to El Niño.
What's the Angle?
Source Institutions
This activity helps learners understand how the angle of the Sun affects temperatures around the globe.