Search Results
Showing results 1 to 10 of 10

Good News: We're on the Rise!
Learners build a simple aneroid barometer to learn about changes in barometric pressure and weather forecasting. They observe their barometer and record data over a period of days.

A Recipe for Air
Learners use M&Ms® (or any other multi-color, equally-sized small candy or pieces) to create a pie graph that expresses the composition of air.

It's a Gas, Man
Source Institutions
In this activity, learners discover if carbon dioxide has an effect on temperature.
Sea State: Forecast Conditions at Sea
Source Institutions
In this oceanography and data collection activity, learners cast real time sea state conditions using buoys from NOAA's National Data Buoy Center.

Mapping Greenhouse Gas Emissions Where You Live
Source Institutions
In this lesson plan, learners examine some of the of greenhouse gas emissions sources in their community.
Does Air Weigh Anything?
Source Institutions
The demonstration/experiment provides quick proof that air has mass.

The Daily Ups and Downs
Source Institutions
In this activity, learners graph 48 hourly air temperatures from a local weather observation site and observe the diurnal temperature variations.
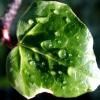
Leaf it to Me
Source Institutions
In this activity, learners observe the effect of transpiration as water is moved from the ground to the atmosphere.

Drawing Conclusions
Source Institutions
In this weather forecasting activity, learners determine the location of cold and warm fronts on weather plot maps.

Water, Water Everywhere
Source Institutions
In this activity, learners estimate how much water they think can be found in various locations on the Earth in all its states (solid, liquid, and gas) to discover the different water ratios in the Ea