Search Results
Showing results 1 to 11 of 11

Earth Atmosphere Composition
Source Institutions
In this activity, learners use rice grains to model the composition of the atmosphere of the Earth today and in 1880. Learners assemble the model while measuring percentages.

Drawing Conclusions
Source Institutions
In this weather forecasting activity, learners determine the location of cold and warm fronts on weather plot maps.
How Greenhouse Gases Absorb Heat
Source Institutions
Learners observe two model atmospheres -- one with normal atmospheric composition and another with an elevated concentration of carbon dioxide.

Mapping Greenhouse Gas Emissions Where You Live
Source Institutions
In this lesson plan, learners examine some of the of greenhouse gas emissions sources in their community.
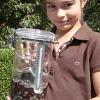
Make a Terrarium
Source Institutions
In this activity, learners make a miniature greenhouse or "terrarium" to explore the greenhouse effect.
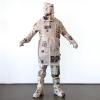
Air Pressure and Dent Pullers
Source Institutions
In this activity, learners simulate Otto von Guericke's famous Magdeburg Hemispheres experiment.

Arctic Sea Ice
Source Institutions
In this activity, learners explore how the area of Arctic sea ice has changed over recent years. First, learners graph the area of Arctic sea ice over time from 1979 to 2007.
Sea State: Forecast Conditions at Sea
Source Institutions
In this oceanography and data collection activity, learners cast real time sea state conditions using buoys from NOAA's National Data Buoy Center.

Percentage of Oxygen in the Air
Source Institutions
In this activity, learners calculate the percentage of oxygen in the atmosphere by using steel wool's ability to rust.
Atmosphere Composition Model
Source Institutions
In this activity, learners create a model using metric measuring tapes and atmosphere composition data.