Search Results
Showing results 1 to 5 of 5

Heat Capacity: Can't Take the Heat?
Source Institutions
Why is ocean water sometimes the warmest when the average daily air temperature starts to drop? In this activity, learners explore the differing heat capacities of water and air using real data.
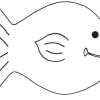
Generating and Recording Data
Source Institutions
In this math activity, learners use a "function machine" to collect and organize simple data. The function machine in this case is a cardboard box and the input/output data are paper fish.
Balance Challenge
Source Institutions
In this quick activity, learners take a balance challenge to measure their average balance time. As they collect data, they investigate how practice and repetition improve their balance time.
Coastal Erosion: Where's the Beach?
Source Institutions
Learners use beach profile data from a local beach or online data from Ocean City, Maryland to investigate coastal erosion and sediment transport.
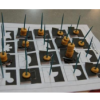
Fruity-Glows: Pictures of Health on a Microarray Canvas
Source Institutions
In this activity (page 12), learners apply the concepts of pixilation and pointillism to the world of biomedical science.