Search Results
Showing results 1 to 7 of 7

Chilean Sea Bass: Off the Menu
Source Institutions
In this data analysis activity, learners use data collected by the Commission for the Conservation of Antarctic Marine Living Resources (CCAMLR) to study Chilean sea bass populations.
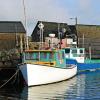
Sustainable Fishing
Source Institutions
In this activity, learners use a model for how fishing affects marine life populations, and will construct explanations for one of the reasons why fish populations are declining.
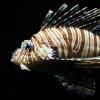
Fish Eyes: More than Meets the Eye
Source Institutions
In this data collection and analysis activity, learners evaluate fish physiology and ecology using vision research data from Dr.
Generating and Recording Data
Source Institutions
In this math activity, learners use a "function machine" to collect and organize simple data. The function machine in this case is a cardboard box and the input/output data are paper fish.
Fishy Observations
Source Institutions
In this activity (page 1 of the PDF under SciGirls Activity: Rabbits), learners will visit a zoo, aquarium, or pet store to view a variety of fish.
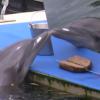
Animal Reflection Response
Source Institutions
In this activity (page 1 of the PDF under SciGirls Activity: Horse Ears), learners observe how an animal responds to its own reflection.

Statistics: Something Fishy
Source Institutions
In this math lesson, learners apply the concepts of ratio and proportion to the capture-recapture statistical procedure.