Search Results
Showing results 1 to 9 of 9
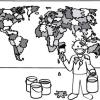
The Poor Cartographer: Graph Coloring
Source Institutions
In this activity, learners help a poor cartographer color in the countries on a map, making sure each country is colored a different color than any of its neighbors.
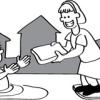
The Muddy City: Minimal Spanning Trees
Source Institutions
In this puzzle, learners investigate the decisions involved in linking a network between houses in a muddy city.
FlyBy Math: Distance-Rate-Time Problems in Air Traffic Control
Source Institutions
In this small-group activity, learners assume the roles of pilots, air traffic controllers, and NASA scientists to solve five Air Traffic Control (ATC) problems.
Transit Tracks
Source Institutions
In this space science activity, learners explore transits and the conditions when a transit may be seen.
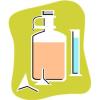
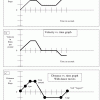
Patterns and Functions: Fill 'er Up
Source Institutions
In this math lesson, learners predict, interpret, and sketch graphs of functions related to the shapes of bottles. A measure of water is poured into a container.

Zoo Calendar
Source Institutions
Use the Zoo Calendar (page 1 of PDF) to involve learners in interdisciplinary, whole language, and writing activities about ecological concepts.
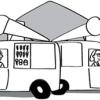
Tourist Town: Dominating Sets
Source Institutions
In this activity, learners use a fictitious map of "Tourist Town" and counters to problem solve how to place ice-cream vans on street intersections so that every other intersection is connected to one
Starburst® Graph
Source Institutions
In this activity, learners use Starburst® candy to sort, classify, compare, and graph. Learners grab a handful of one-inch candy squares, sort them by color, graph the candy, and discuss the results.
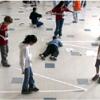
Graph Dance
Source Institutions
In this activity, learners "dance" (move back and forth at varying speeds) by reading a graph. This is a kinesthetic way to help learners interpret and understand how motion is graphed.