Search Results
Showing results 1 to 5 of 5
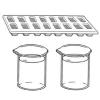
Investigating Density Currents
Source Institutions
In this lab activity, learners explore how to initiate a density current. Learners measure six flasks with different concentrations of salt and water (colored blue).
Sea State: Forecast Conditions at Sea
Source Institutions
In this oceanography and data collection activity, learners cast real time sea state conditions using buoys from NOAA's National Data Buoy Center.
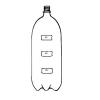
Under Pressure
Source Institutions
In this experiment, learners examine how pressure affects water flow. In small groups, learners work with water and a soda bottle, and then relate their findings to pressure in the deep ocean.
Sinking Water
Source Institutions
In this experiment, learners float colored ice cubes in hot and cold water.

Heat Capacity: Can't Take the Heat?
Source Institutions
Why is ocean water sometimes the warmest when the average daily air temperature starts to drop? In this activity, learners explore the differing heat capacities of water and air using real data.