Search Results
Showing results 1 to 9 of 9

Inverse Functions: Pennies, Pressure, Temperature, and Light
Source Institutions
The major goal of this math lesson is to have learners collect data from a variety of experiments, determine what models best fits their data, and explain why their models are best.
Weather Stations: Temperature and Pressure
Source Institutions
In this activity, learners discover the relationship between temperature and pressure in the lower atmospheres of Jupiter and Earth.
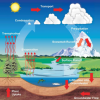
Weather Stations: Phase Change
Source Institutions
In this activity, learners observe the water cycle in action! Water vapor in a tumbler condenses on chilled aluminum foil — producing the liquid form of water familiar to us as rain and dew.

What Causes Pressure?
Source Institutions
In this kinesthetic activity that demonstrates pressure, learners act as air molecules in a "container" as defined by a rope.
If Hot Air Rises, Why is it Cold in the Mountains?
Source Institutions
This demonstration/activity helps learners understand why higher elevations are not always warm simply because "hot air rises." Learners use a tire pump to increase the pressure and temperature inside
Convection Demonstration
Source Institutions
In this quick activity (located on page 2 of the PDF under GPS: Balloon Fiesta Activity), learners will see the effects of convection and understand what makes hot air balloons rise.
What is a “Convection Cell”?
Source Institutions
In this demonstration, learners can observe a number of small convection cells generated from a mixture of aluminum powder and silicon oil on a hot plate.

That Sinking Feeling
Source Institutions
In this quick activity, learners observe how salinity and temperature affect the density of water, to better understand the Great Ocean Conveyor.

Drawing Conclusions
Source Institutions
In this weather forecasting activity, learners determine the location of cold and warm fronts on weather plot maps.
