Search Results
Showing results 1 to 7 of 7
Why Doesn’t the Ocean Freeze?
Source Institutions
In this activity, learners explore how salt water freezes in comparison to fresh water.

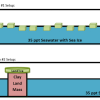
It's a Gas, Man
Source Institutions
In this activity, learners discover if carbon dioxide has an effect on temperature.
Sea State: Forecast Conditions at Sea
Source Institutions
In this oceanography and data collection activity, learners cast real time sea state conditions using buoys from NOAA's National Data Buoy Center.
Fish Eyes: More than Meets the Eye
Source Institutions
In this data collection and analysis activity, learners evaluate fish physiology and ecology using vision research data from Dr.
The Return of El Nino
Source Institutions
In this activity related to climate change and data analysis, learners examine temperature and precipitation data to determine if climate variations are due to El Niño.
Causes and Effects of Melting Ice
Source Institutions
In this activity, learners explore the concept of density-driven currents (thermohaline circulation) and how these currents are affected by climate change.

The Dead Zone: A Marine Horror Story
Source Institutions
In this environmental science and data analysis activity, learners work in groups to track a Dead Zone (decreased dissolved oxygen content of a body of water) using water quality data from the Nutrien