Search Results
Showing results 1 to 20 of 50
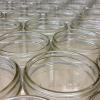
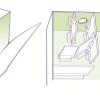
Hot Stuff!: Investigation #4
Learners test two jars containing soil, one covered and one open, for changes in temperature. After placing the jars in the Sun, learners discover that the covered jar cools down more slowly.

Dripping Wet or Dry as a Bone?
Learners investigate the concept of humidity by using a dry and wet sponge as a model. They determine a model for 100% humidity, a sponge saturated with water.
Hot Stuff!: Investigation #1
Learners test two jars, one containing plain air and one containing carbon dioxide gas, to see their reactions to temperature changes.
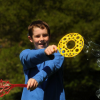
Wind Mapping with Bubbles
Source Institutions
Discover the wind's direction using bubbles, a map and a keen eye. Learners blow bubbles and note their general direction on a map, taking readings from different points around a building.

How Much Water is in that Cloud?
Source Institutions
In this activity, learners working in pairs saturate a cotton ball using water drops from an eyedropper to demonstrate the high water capacity of clouds.
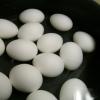
Salt 'n Lighter
Source Institutions
In this activity, learners discover that as the salinity of water increases, the density increases as well. Learners prove this by attempting to float fresh eggs in saltwater and freshwater.

Earth's Energy Cycle: Albedo
Source Institutions
In this activity, learners experiment and observe how the color of materials that cover the Earth affects the amounts of sunlight our planet absorbs.
Why Doesn’t the Ocean Freeze?
Source Institutions
In this activity, learners explore how salt water freezes in comparison to fresh water.

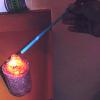
It's a Gas, Man
Source Institutions
In this activity, learners discover if carbon dioxide has an effect on temperature.
Sea State: Forecast Conditions at Sea
Source Institutions
In this oceanography and data collection activity, learners cast real time sea state conditions using buoys from NOAA's National Data Buoy Center.
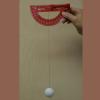
Measuring Wind Speed
Source Institutions
In this indoor and/or outdoor activity, learners make an anemometer (an instrument to measure wind speed) out of a protractor, a ping pong ball and a length of thread or fishing line.
Hexagon Hunt
Source Institutions
This activity gets learners looking at 6-sided shapes in nature, including the cells of a beehive, as well as other shapes.

How can Clouds Help Keep the Air Warmer?
Source Institutions
In this activity, learners explore how air warms when it condenses water vapor or makes clouds.
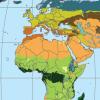
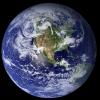
Discovering Rainforest Locations
Source Institutions
In this activity, learners will examine various world data maps to combine the information and predict which areas could be tropical rainforests.
My Angle on Cooling: Effects of Distance and Inclination
Source Institutions
In this activity, learners discover that one way to cool an object in the presence of a heat source is to increase the distance from it or change the angle at which it is faced.
Understanding Albedo
Source Institutions
In this activity related to climate change, learners examine albedo and the ice albedo feedback effect as it relates to snow, ice, and the likely results of reduced snow and ice cover on global temper
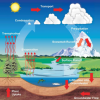
Weather Stations: Phase Change
Source Institutions
In this activity, learners observe the water cycle in action! Water vapor in a tumbler condenses on chilled aluminum foil — producing the liquid form of water familiar to us as rain and dew.

Disappearing Statues
Source Institutions
In this activity (on page 8), learners model how marble statues and buildings are affected by acid rain.
The Shadow Knows II
Source Institutions
In this activity, learners will measure the length of a shadow and use the distance from the equator to calculate the circumference of the earth.
Old Faithful Plumbing Investigation
Source Institutions
This activity (located on page 3 of the PDF) is a full inquiry investigation into mapping the underground “plumbing” of geysers.