Source Institutions
Source Institutions
Add to list Go to activity
Activity link broken? See if it's at the internet archive

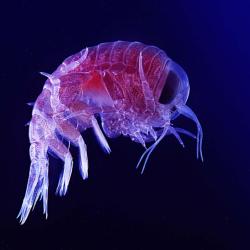
In this data analysis and environmental science activity, learners examine the effects of pollution on amphipods using data from the Chesapeake Ecotox Research Program. Learners calculate the average reburrowing time for four different treatments (placement in different sediment types) and create a bar graph comparing averages for all four treatments. Educators can use this activity to introduce learners to data analysis, biological indicators, and the research process.
- Under 5 minutes
- 45 to 60 minutes
- $1 - $5 per student
- Ages 14 - 18
- Activity, Lesson/Lesson Plan
- English
Quick Guide
Materials List (per student)
- Graphing paper
- Ruler
- Computer with internet access
- Pen or pencil
Subjects
-
Earth and Space Science
-
Earth Structure
- Rocks and Minerals
- Oceans and Water
-
Earth Structure
-
Life Sciences
-
Diversity of Life
- Plants
- Animals
-
Ecology
- Ecosystems
- Populations
- Biodiversity
- Human Impact
-
Diversity of Life
-
Mathematics
-
Data Analysis and Probability
- Data Analysis
- Data Representation
-
Number and Operations
- Fractions
- Operations
- Representation
-
Data Analysis and Probability
-
The Nature of Science
-
The Scientific Process
- Conducting Investigations
- Gathering Data
- Formulating Explanations
- Communicating Results
-
The Scientific Process
Informal Categories
- Animals
- Nature and Environment
Audience
To use this activity, learners need to:
- see
- read
- use keyboard
- use mouse
- touch
Learning styles supported:
- Uses STEM to solve real-world problems
- Involves hands-on or lab activities
Other
Includes alignment to state and/or national standards:
This resource is part of:
Access Rights:
- Free access
By:
- Ayers Lawrence, Lisa
Rights:
- All rights reserved, Virginia Sea Grant Marine Advisory Program,
Funding Sources:
- NOAA Sea Grant
- National Marine Educators Association
