Source Institutions
Source Institutions
Add to list Go to activity
Activity link broken? See if it's at the internet archive
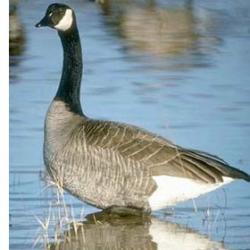
In this activity, learners will explore trends in Canada goose populations using real data from the National Audubon Society's Christmas Bird Count. Objectives include learning the differences between migratory and resident Canada goose populations, graphing geese population numbers with historical count data and predicting Canada goose population trends in your area.
- 10 to 30 minutes
- 1 to 2 hours
- free per student
- Ages 14 - 18
- Activity, Lesson/Lesson Plan
- English
Quick Guide
Materials List (per student)
- graphing paper
- computer with Internet access
Subjects
-
Life Sciences
-
Diversity of Life
- Animals
-
Ecology
- Ecosystems
- Biodiversity
- Human Impact
-
Diversity of Life
-
Mathematics
-
Data Analysis and Probability
- Data Analysis
- Data Collection
- Data Representation
-
Data Analysis and Probability
-
The Nature of Science
-
The Scientific Process
- Gathering Data
-
The Scientific Process
Informal Categories
- Animals
- Citizen Science
- Nature and Environment
Audience
To use this activity, learners need to:
- see
- read
- use keyboard
- use mouse
Learning styles supported:
- Uses STEM to solve real-world problems
Other
Components that are part of this resource:
Includes alignment to state and/or national standards:
This resource is part of:
Access Rights:
- Free access
By:
- Lawrence, Lisa Ayers
Rights:
Funding Source:
- Virginia Sea Grant Marine Advisory Program