Source Institutions
Source Institutions
Add to list Go to activity
Activity link broken? See if it's at the internet archive

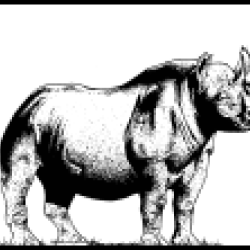
In this math lesson, learners model exponential decay and exponential growth using M&M's, paper folding, and African rhino population data. Learners collect data, create scatterplots, and determine algebraic models that represent their functions. The objectives of this lesson are for learners to explore patterns of exponential models in tables, graphs, and symbolic forms and to apply what they have learned to make predictions in a real situation.
- Under 5 minutes
- 1 to 2 hours
- $1 - $5 per group of students
- Ages 14 - 18
- Activity, Lesson/Lesson Plan
- English
Quick Guide
Materials List (per group of students)
- Graphing calculator with overhead unit
- Graphing calculators
- Overhead projector
- Paper
- Graph paper
- Small bags of M&M's
- Paper Folding activity sheets
- The M&M Investigation activity sheets
- African Rhino activity sheets
- Individual white boards (optional)
Subjects
-
Life Sciences
-
Diversity of Life
- Animals
-
Ecology
- Populations
-
Diversity of Life
-
Mathematics
-
Algebra
- Equations and Inequalities
- Patterns
- Variables and Expressions
-
Data Analysis and Probability
- Data Analysis
- Data Collection
- Data Representation
- Probability
-
Number and Operations
- Exponents
- Reasoning and Proof
- Representation
-
Algebra
-
The Nature of Technology
-
The Design Process
- Problem Solving
-
The Design Process
Informal Categories
- Animals
- Food and Cooking
Audience
To use this activity, learners need to:
- see
- read
- touch
Learning styles supported:
- Involves teamwork and communication skills
- Involves hands-on or lab activities
Other
This resource is part of:
Access Rights:
- Free access
By:
Rights:
- All rights reserved, PBS, 2012
Funding Source:
- US Department of Education
