Source Institutions
Source Institutions
Add to list Go to activity
Activity link broken? See if it's at the internet archive

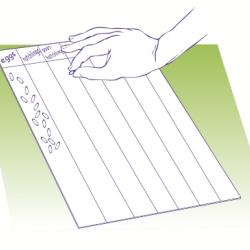
In this activity (on page 2 of PDF under GPS: Sea Turtles Activity), learners will model how a sea turtle population changes over time, from eggs to adults, using puffed rice. Learners create a chart, calculate population fluctuation for each transitional stage of sea turtles' lives, and graph the population at each stage. Learners investigate different factors including migration and human fishing that affect the size of the sea turtle population. Relates to the linked video, DragonflyTV GPS: Sea Turtles.
- Under 5 minutes
- 30 to 45 minutes
- 1 cent - $1 per group of students
- Ages 8 - 14
- Activity, Lesson/Lesson Plan, Model, Simulation
- English
Quick Guide
Materials List (per group of students)
- puffed rice (approx. 300 grains per student or group)
- a 16-oz. plastic or paper cup, one per group, to hold the rice
- a 8.5" x 14" sheet of paper, one per group
- pencils and rulers
Subjects
-
Life Sciences
-
Diversity of Life
- Animals
-
Ecology
- Populations
- Human Impact
-
Diversity of Life
-
Mathematics
-
Algebra
- Equations and Inequalities
-
Data Analysis and Probability
- Data Analysis
- Data Collection
- Data Representation
-
Number and Operations
- Multiples and Factors
- Representation
-
Algebra
-
The Nature of Science
-
The Scientific Process
- About Inquiry
- Conducting Investigations
- Gathering Data
- Formulating Explanations
- Communicating Results
-
The Scientific Process
Informal Categories
- Animals
- Nature and Environment
Audience
To use this activity, learners need to:
- see
- read
- touch
Learning styles supported:
- Involves teamwork and communication skills
- Involves hands-on or lab activities
Other
Components that are part of this resource:
This resource is part of:
Access Rights:
- Free access
By:
Source Collection
- DragonflyTV
Rights:
- All rights reserved, Twin Cities Public Television, Inc., 2007
Funding Source:
- National Science Foundation, 610429
