Source Institutions
Source Institutions
Add to list Go to activity
Activity link broken? See if it's at the internet archive

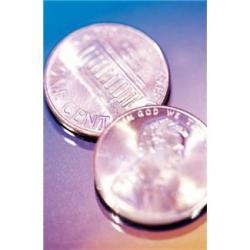
In this math lesson, learners learn how to construct stem and leaf plots. Learners first estimate the number of drops of water that will fit on the head of a penny. Learners write their guesses on Post-it notes and arrange the notes in a stem and leaf plot. Then, learners conduct the experiment and record the results on Post-its that are displayed on the same stem and leaf plot, thus creating a back-to-back stem and leaf plot. Learners work in groups to analyze the data, paying particular attention to the data range and the extent to which different variables may have contributed to any disparities.
- Under 5 minutes
- 45 to 60 minutes
- 1 cent - $1 per group of students
- Ages 11 - 14
- Activity, Experiment/Lab Activity, Lesson/Lesson Plan
- English
Quick Guide
Materials List (per group of students)
- Post-It Notes
- Pennies
- Eye droppers
- Paper towels
- Cups of water
- Markers
- Activity Sheets
- Two large sheets of poster board or large space on a clean blackboard
Subjects
-
Mathematics
-
Data Analysis and Probability
- Data Analysis
- Data Collection
- Data Representation
- Probability
- Reasoning and Proof
- Representation
-
Data Analysis and Probability
-
The Nature of Technology
-
The Design Process
- Problem Solving
-
The Design Process
-
Physical Sciences
- Structure and Properties of Matter
-
The Nature of Science
-
The Scientific Process
- Conducting Investigations
- Gathering Data
- Formulating Explanations
- Communicating Results
-
The Scientific Process
Audience
To use this activity, learners need to:
- see
- read
- touch
Learning styles supported:
- Involves teamwork and communication skills
- Involves hands-on or lab activities
Other
This resource is part of:
Access Rights:
- Free access
By:
Rights:
- All rights reserved, PBS, 2012
Funding Source:
- US Department of Education
