NOAA
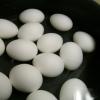
Salt 'n Lighter
Source Institutions
In this activity, learners discover that as the salinity of water increases, the density increases as well. Learners prove this by attempting to float fresh eggs in saltwater and freshwater.
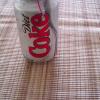
Diet Light
Source Institutions
In this quick activity, learners observe how the added sugar in a can of soda affects its density and thus, its ability to float in water.

Quadraphonic Wind
Source Institutions
In this activity, learners discover how the extent of various wind speeds changes in each of the four quadrants around a hurricane.
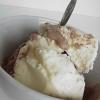
We all Scream for Ice Cream
Source Institutions
In this activity, learners observe how salinity affects the freezing point of water by making and enjoying ice cream.
Updrafts in Action
Source Institutions
In this weather activity/demonstration, learners watch as a ping pong ball is suspended in a stream of air supplied by a hair dryer.

Earth's Energy Cycle: Albedo
Source Institutions
In this activity, learners experiment and observe how the color of materials that cover the Earth affects the amounts of sunlight our planet absorbs.

The Rumblin' Road: Determining distance to a Thunderstorm
Source Institutions
In this activity, learners discover how to determine the distance to a lightning strike or nearby thunderstorm.

How Much Water is in that Cloud?
Source Institutions
In this activity, learners working in pairs saturate a cotton ball using water drops from an eyedropper to demonstrate the high water capacity of clouds.

A Funny Taste
Source Institutions
In this activity, learners explore the different salinities of various sources of water by taste-testing.

If Anyone Can, Icon
Source Institutions
In this activity, learners create their own icons for a forecast-at-a-glance poster for their classroom/learning space.