Search Results
Showing results 1 to 16 of 16
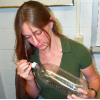
If Hot Air Rises, Why is it Cold in the Mountains?
Source Institutions
This demonstration/activity helps learners understand why higher elevations are not always warm simply because "hot air rises." Learners use a tire pump to increase the pressure and temperature inside
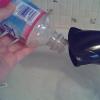
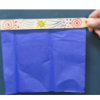
Air Pressure
Source Institutions
In this experiment, learners use a blow dryer and water bottle to observe and record changes in air pressure caused by changes in temperature.

Heat Capacity: Can't Take the Heat?
Source Institutions
Why is ocean water sometimes the warmest when the average daily air temperature starts to drop? In this activity, learners explore the differing heat capacities of water and air using real data.
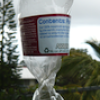
Crunch Time
Source Institutions
In this quick and easy activity and/or demonstration, learners use two empty 2-liter bottles and hot tap water to illustrate the effect of heat on pressure.
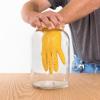
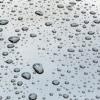
Fog Chamber
Source Institutions
In this weather-related activity, learners make a portable cloud in a bottle.
Draft Detectives
Source Institutions
In this two part activity, learners become draft detectives by constructing their own draft catchers to detect drafts around windows or doors.

That Sinking Feeling
Source Institutions
In this quick activity, learners observe how salinity and temperature affect the density of water, to better understand the Great Ocean Conveyor.

Drawing Conclusions
Source Institutions
In this weather forecasting activity, learners determine the location of cold and warm fronts on weather plot maps.

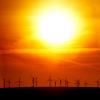
Wind Power: Creating a Wind Generator
Source Institutions
This lesson challenges groups of learners to design and construct a wind generator with the most electrical output.
Solar Energy
Source Institutions
In this activity (page 11 of PDF), learners compare the air pressure within a dark and a light bottle both heated by the sun, and discover that solar energy can be collected and stored in many ways

Toasty Wind
Source Institutions
In this quick activity, learners use a toaster to investigate the source for the Earth's wind. Learners hold a pinwheel above a toaster to discover that rising heat causes wind.

The Rumblin' Road: Determining distance to a Thunderstorm
Source Institutions
In this activity, learners discover how to determine the distance to a lightning strike or nearby thunderstorm.
Atmospheric Collisions
Source Institutions
In this activity/demonstration, learners observe what happens when two ping pong balls are suspended in the air by a hair dryer. Use this activity to demonstrate how rain drops grow by coalescence.
Haunted by Hurricanes: Use Data to Learn About Hurricanes
Source Institutions
In this activity, learners will determine if the frequency and intensity of hurricanes are changing using real data from the National Hurricane Center.

What Causes Wind?
Source Institutions
In this sunny day experiment, learners measure and compare how quickly light and dark colored materials absorb heat.

The Daily Ups and Downs
Source Institutions
In this activity, learners graph 48 hourly air temperatures from a local weather observation site and observe the diurnal temperature variations.