Search Results
Showing results 1 to 11 of 11
The Search for Secret Agents
Learners tour their school or home looking for sources of indoor air pollutants (IAPs).
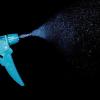
Bernoulli's Blowout
Source Institutions
In this quick activity (page 1 of PDF under SciGirls Activity: Kites), learners will witness firsthand the effects of Bernoulli’s Principle by capturing a ping pong ball in the stream of air created b

Drawing Conclusions
Source Institutions
In this weather forecasting activity, learners determine the location of cold and warm fronts on weather plot maps.
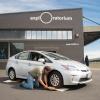
Tired Weight
Source Institutions
Yes, you can weigh your car by figuring out your wheel's tire pressure combined with the "tire's footprint." You'll need someone with a car, driver's license, and safety in mind.
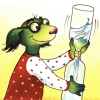
Twist and Spout
Source Institutions
In this activity, learners make their own "tornado" using two soda bottles and water.

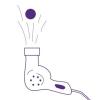
Bronx Cheer Bulb
Source Institutions
In this activity, learners observe what happens when they give a light source like a neon glow lamp a "Bronx Cheer." The lights appear to wiggle back and forth and flicker when learners blow air throu

The Rumblin' Road: Determining distance to a Thunderstorm
Source Institutions
In this activity, learners discover how to determine the distance to a lightning strike or nearby thunderstorm.
Atmospheric Collisions
Source Institutions
In this activity/demonstration, learners observe what happens when two ping pong balls are suspended in the air by a hair dryer. Use this activity to demonstrate how rain drops grow by coalescence.
Haunted by Hurricanes: Use Data to Learn About Hurricanes
Source Institutions
In this activity, learners will determine if the frequency and intensity of hurricanes are changing using real data from the National Hurricane Center.

Cup Sailing Game
Source Institutions
In this online Flash game, learners will captain a sailing challenge, adjusting boat direction and sails, seeking the way to take greatest advantage of varying wind speeds and directions to catch the

The Daily Ups and Downs
Source Institutions
In this activity, learners graph 48 hourly air temperatures from a local weather observation site and observe the diurnal temperature variations.