Search Results
Showing results 1 to 5 of 5
Dunking the Planets
Source Institutions
In this demonstration, learners compare the relative sizes and masses of scale models of the planets as represented by fruits and other foods.
Cookie Surface Area
Source Institutions
This is an activity (on page 2 of the PDF under Surface Area Activity) about surface area to volume ratio.
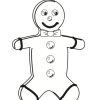
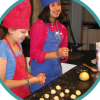
Eatem Up
Source Institutions
In this math activity, learners use gingerbread cookies to collect and organize simple data. First, learners read "The Gingerbread Boy" by Paul Galdone.
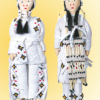
Plenty on the Plains
Source Institutions
In this activity, learners compare the ways of life of Plains Native Americans who hunted and moved frequently to follow the buffalo herds, and Native Americans who farmed and lived in more permanent
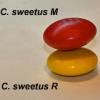
Survival of the Fittest: Variations in the Clam Species Clamys sweetus
Source Institutions
This guided inquiry three-part activity engages learners in thinking about the mechanism of natural selection by encouraging them to formulate questions that can be answered through scientific investi