Search Results
Showing results 1 to 7 of 7
Experiment with Fat
Source Institutions
In this nutrition/food science activity, learners conduct an experiment and record data to compare the amount of fat in different foods.
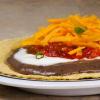
Creating Tostadas
Source Institutions
In this activity, learners develop their understanding of combinations as they create as many different kinds of tostadas as possible.
Starburst® Graph
Source Institutions
In this activity, learners use Starburst® candy to sort, classify, compare, and graph. Learners grab a handful of one-inch candy squares, sort them by color, graph the candy, and discuss the results.
Measuring Rules
Source Institutions
In this math activity, learners create their own units of measurement by making noodle rulers. Learners practice estimating and measuring objects using the noodle rulers .
Breakfast Sweets
Source Institutions
In this math activity, learners guess which cereals contain the most sugar. Learners use the nutrition labels on the cereal boxes to find the cereal with the least amount of sugar.

Bake Sale
Source Institutions
This activity helps learners learn about math through a real-world scenario. Three friends are baking cookies for their school’s bake sale.
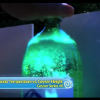
Temperature vs. Height: Soda Geyser Series #6
Source Institutions
In this activity, learners conduct a controlled experiment to examine how temperature will affect the height of a soda geyser.