Search Results
Showing results 1 to 8 of 8
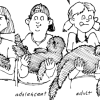
Otter Smorgasbord
Source Institutions
In this graphing activity (on pages 33-40), learners investigate how much and what kinds of food sea otter pups eat during their first year of life.

Tree-mendous Plots
Source Institutions
In this math lesson, learners record and graph plant growth and interpret data. Learners plant seeds, and once the seeds sprout, record the change in height of the plants for several days.
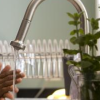
Home Water Audit
Source Institutions
This activity offers learners and their families several ways to raise their awareness together about home water.
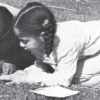
Bean Bugs
Source Institutions
In this outdoor biology and math activity, learners estimate the size of a population of organisms too numerous to count.

Statistics: Something Fishy
Source Institutions
In this math lesson, learners apply the concepts of ratio and proportion to the capture-recapture statistical procedure.
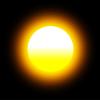
Oil Spot Photometer
Source Institutions
In this math activity related to light, learners assemble a photometer and use it to estimate the power output of the Sun.
Hold a Hill
Source Institutions
In this outdoor activity, learners investigate the relationship between the slope of a trail and soil erosion.
Trail Impact Study
Source Institutions
In this outdoor activity, learners plan a simple foot path and create an environmental impact study of the natural area where the path would be.