Search Results
Showing results 1 to 6 of 6
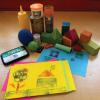
Shape Stamping
Source Institutions
In this activity, learners will explore two-dimensional shapes that are found in three-dimensional shapes. Learners will explore geometry, design, color and tool use through this activity.

Exponential Models: Rhinos and M&M’s ®
Source Institutions
In this math lesson, learners model exponential decay and exponential growth using M&M's, paper folding, and African rhino population data.

Statistics: Steppin' Out
Source Institutions
In this math lesson, learners construct box-and-whisker plots to analyze and compare data sets. Learners investigate whether or not long-legged people run faster than short-legged people.

Statistics: Creature Features
Source Institutions
In this math activity, learners collect, organize, and analyze a set of data related to types of animals in the temperate forest.
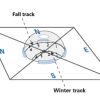
Reason for the Seasons
Source Institutions
In this activity (on page 6 of the PDF), learners plot the path of the sun's apparent movement across the sky on two days, with the second day occurring two or three months after the first.
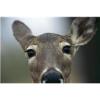
An Interdisciplinary Deer and Human Population Study
Source Institutions
This activity helps the learner answer the question: "What environmental problems arise due to animal and human overpopulation and what might need to be done to combat these problems?" Learners play a