Search Results
Showing results 1 to 7 of 7
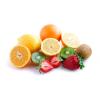
Pennies for Pits
Source Institutions
In this math lesson, learners use fruit to learn about proportions and percentages. Learners compare the weights of the edible and non-edible portions of fruit.
Pattern Families
Source Institutions
In this math activity, learners sort patterns into similar "families" or groups that have the same pattern, but different symbols.
Breakfast Sweets
Source Institutions
In this math activity, learners guess which cereals contain the most sugar. Learners use the nutrition labels on the cereal boxes to find the cereal with the least amount of sugar.
More Bubbles!
Source Institutions
In this math activity, learners make their own bubble wands and determine if the size of the wand affects the number of bubbles it produces.

Multi-Variable Relations: Stressed to the Breaking Point
Source Institutions
In this math lesson, learners explore the relationship between the thickness of a spaghetti bridge, the length of the bridge, and the amount of weight that can be supported by the bridge.

Tree-mendous Plots
Source Institutions
In this math lesson, learners record and graph plant growth and interpret data. Learners plant seeds, and once the seeds sprout, record the change in height of the plants for several days.

Statistics: Something Fishy
Source Institutions
In this math lesson, learners apply the concepts of ratio and proportion to the capture-recapture statistical procedure.