Search Results
Showing results 1 to 9 of 9

The Daily Ups and Downs
Source Institutions
In this activity, learners graph 48 hourly air temperatures from a local weather observation site and observe the diurnal temperature variations.

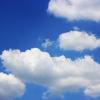
Forward Thinking
Source Institutions
In this activity, learners create their own weather forecast map.
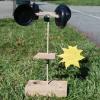
Weather Vane and Anemometer
Source Institutions
In this meteorology activity, learners construct simple devices to measure the direction and speed of wind.
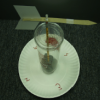
Design and Build a Wind Vane
Source Institutions
In this activity, learners design and build a simple wind vane —one of the oldest kinds of weather tools— and use it to show wind direction.

It's the "Rain," Man
Source Institutions
In this weather forecasting activity, learners use common materials to construct a rain gauge and measure daily, monthly, and yearly rainfall.
Running in Circles
Source Institutions
In this group activity, learners use some common objects and work together to simulate the Coriolis effect. During the challenge, learners make predictions and test different scenarios.
Carbon Cycle Poster
Source Institutions
In this activity, learners gain knowledge about how carbon moves through all four of the Earth’s major spheres (biosphere, hydrosphere, atmosphere, and lithosphere), and understand how humans influenc

Dripping Wet or Dry as a Bone?
Learners investigate the concept of humidity by using a dry and wet sponge as a model. They determine a model for 100% humidity, a sponge saturated with water.
We all Scream for Ice Cream
Source Institutions
In this activity, learners observe how salinity affects the freezing point of water by making and enjoying ice cream.