Search Results
Showing results 1 to 5 of 5

The Daily Ups and Downs
Source Institutions
In this activity, learners graph 48 hourly air temperatures from a local weather observation site and observe the diurnal temperature variations.

Forward Thinking
Source Institutions
In this activity, learners create their own weather forecast map.

It's the "Rain," Man
Source Institutions
In this weather forecasting activity, learners use common materials to construct a rain gauge and measure daily, monthly, and yearly rainfall.

Dripping Wet or Dry as a Bone?
Learners investigate the concept of humidity by using a dry and wet sponge as a model. They determine a model for 100% humidity, a sponge saturated with water.
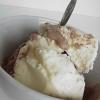
We all Scream for Ice Cream
Source Institutions
In this activity, learners observe how salinity affects the freezing point of water by making and enjoying ice cream.