Search Results
Showing results 1 to 14 of 14
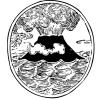
Lava Layering: Making and Mapping a Volcano
Source Institutions
In this activity, learners discover how geologists use stratigraphy, the study of layered rock, to understand the sequence of geological events.
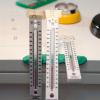
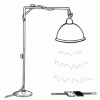
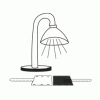
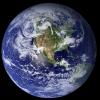
Hot Equator, Cold Poles
Source Institutions
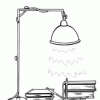
In this activity, learners use multiple thermometers, placed at different angles, and a lamp to investigate why some places on Earth's surface are much hotter than others.
Amazing Albedo
Source Institutions
In this experiment, learners work in teams to investigate how the color of a surface influences its ability to reflect light and therefore heat.

Earth's Energy Cycle: Albedo
Source Institutions
In this activity, learners experiment and observe how the color of materials that cover the Earth affects the amounts of sunlight our planet absorbs.
Coastal Erosion: Where's the Beach?
Source Institutions
Learners use beach profile data from a local beach or online data from Ocean City, Maryland to investigate coastal erosion and sediment transport.
Sea State: Forecast Conditions at Sea
Source Institutions
In this oceanography and data collection activity, learners cast real time sea state conditions using buoys from NOAA's National Data Buoy Center.
Understanding Albedo
Source Institutions
In this activity related to climate change, learners examine albedo and the ice albedo feedback effect as it relates to snow, ice, and the likely results of reduced snow and ice cover on global temper
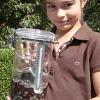
Make a Terrarium
Source Institutions
In this activity, learners make a miniature greenhouse or "terrarium" to explore the greenhouse effect.
The Shadow Knows II
Source Institutions
In this activity, learners will measure the length of a shadow and use the distance from the equator to calculate the circumference of the earth.
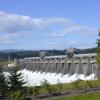
The Best Dam Simulation Ever
Source Institutions
This online simulation game explores the different consequences of water levels on the Columbia River in the Pacific Northwest.
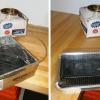
Solar Water Heater
Learners work in teams to design and build solar water heating devices that mimic those used in residences to capture energy in the form of solar radiation and convert it to thermal energy.
The Return of El Nino
Source Institutions
In this activity related to climate change and data analysis, learners examine temperature and precipitation data to determine if climate variations are due to El Niño.
What's the Angle?
Source Institutions
This activity helps learners understand how the angle of the Sun affects temperatures around the globe.
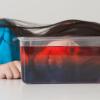
Freezing Lakes
Source Institutions
In some parts of the world, lakes freeze during winter. In this activity learners will explore water’s unique properties of freezing and melting, and how these relate to density and temperature.