Search Results
Showing results 1 to 3 of 3
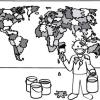
The Poor Cartographer: Graph Coloring
Source Institutions
In this activity, learners help a poor cartographer color in the countries on a map, making sure each country is colored a different color than any of its neighbors.
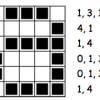
Colour by Numbers: Image Representation
Source Institutions
This activity shows learners how computers use numbers to represent pictures. A grid is used to represent the pixels (short for picture elements) of a computer screen.
Sound Representation: Modems Unplugged
Source Institutions
In this activity, learners listen to songs and decode hidden messages based on the same principle as a modem. As a final challenge, learners decode the binary messages in a music video.