Search Results
Showing results 1 to 8 of 8

What Causes Wind?
Source Institutions
In this sunny day experiment, learners measure and compare how quickly light and dark colored materials absorb heat.
Differing Densities: Fresh and Salt Water
Source Institutions
In this activity, learners visualize the differences in water density and relate this to the potential consequences of increased glacial melting.
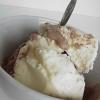
We all Scream for Ice Cream
Source Institutions
In this activity, learners observe how salinity affects the freezing point of water by making and enjoying ice cream.

That Sinking Feeling
Source Institutions
In this quick activity, learners observe how salinity and temperature affect the density of water, to better understand the Great Ocean Conveyor.
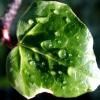
Leaf it to Me
Source Institutions
In this activity, learners observe the effect of transpiration as water is moved from the ground to the atmosphere.
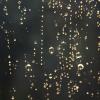
The Rain Man
Source Institutions
In this activity, learners observe the hydrologic cycle in action as water evaporates and condenses to form rain right before their eyes.
Use Clues to Solve an Ice Mystery
Source Institutions
Learners explore the variables that affect the properties of ice and the places where different types of ice are found.
Global Climate Change and Sea Level Rise
Source Institutions
In this activity, learners practice the steps involved in a scientific investigation while learning why ice formations on land (not those on water) will cause a rise in sea level upon melting.