Source Institutions
Source Institutions
Add to list Go to activity
Activity link broken? See if it's at the internet archive

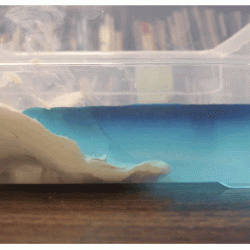
In this activity, learners visualize the differences in water density and relate this to the potential consequences of increased glacial melting. This activity can be conducted as a demonstration and works best as an extension to the activity "Global Climate Change and Sea Level Rise".
- 10 to 30 minutes
- 2 to 4 hours
- $5 - $10 per group of students
- Ages 8 - 14
- Activity, Demonstration, Lesson/Lesson Plan
- English
Quick Guide
Materials List (per group of students)
- one clear food storage box (approximately 6 inch square)
- 4 sticks of classroom modeling clay
- blue food coloring
- ice cube trays
- 4-5 intensely colored ice cubes
- salt
- 1/2 liter of refrigerated water
- Differing Densities Worksheet
Subjects
-
Earth and Space Science
-
Earth Processes
- Weather and Climate
-
Earth Structure
- Oceans and Water
-
Earth Processes
-
Life Sciences
-
Ecology
- Human Impact
-
Ecology
-
Physical Sciences
-
Heat and Thermodynamics
- Heat and Temperature
-
States of Matter
- Changes of Phase
-
Structure and Properties of Matter
- Mass and Weight
- Volume and Density
-
Heat and Thermodynamics
-
The Nature of Science
-
Science and Society
- Risks and Benefits
- Public Policy
-
The Scientific Process
- Conducting Investigations
- Formulating Explanations
- Communicating Results
-
Science and Society
-
The Nature of Technology
-
Technology and Society
- Technology and the Environment
-
Technology and Society
Informal Categories
- Nature and Environment
Audience
To use this activity, learners need to:
- see
- see color
- touch
Learning styles supported:
- Involves teamwork and communication skills
- Uses STEM to solve real-world problems
- Involves hands-on or lab activities
Other
Components that are part of this resource:
This resource is part of:
Access Rights:
- Free access
By:
Rights:
- All rights reserved, California Academy of Sciences, 2008
