Search Results
Showing results 1 to 8 of 8
Number Sense and Computation: Soak It Up
Source Institutions
In this math lesson, learners compare products to determine the best product.
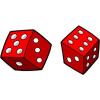
Chances Are: It's a Mystery to Me
Source Institutions
In this math lesson, learners extend their understanding of basic probability concepts as they learn to name all of the possible outcomes of an event as well as ways to express the likelihood of such
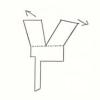
Chances Are: OH NO! Look Out Below for a UFO
Source Institutions
In this math lesson (on Page 13), learners predict and simulate the likelihood of an event occurring.
Number Sense and Computation: Food For Thought
Source Institutions
In this math lesson, learners identify and compare unit costs of given items. Learners use computation skills, problem solving and number sense to find the cost of an ounce of cereal.
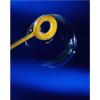
Measurement: Bubble Mania
Source Institutions
In this math lesson, learners practice measurement skills as they examine a soap bubble print. Learners follow a recipe to make a soap bubble solution.
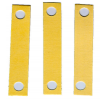
Patterns and Relationships: Struts 'n Stuff
Source Institutions
In this math lesson, learners identify the relationship between the number of sides in a regular polygon and the number of struts needed to make each polygon rigid.
Probability: Chances Are
Source Institutions
In this math lesson, learners identify the likelihood of an event by using a walk-on probability scale.
Statistics: Whirlybirds
Source Institutions
In this math lesson, learners measure, predict and determine the frequency of an event as it relates to how close Whirlybirds land to a target.