Search Results
Showing results 1 to 13 of 13
Animal & Plant Cell Slides
Source Institutions
In this activity, learners make slides of onion cells and their own cheek cells. Use this lab to teach learners how to prepare microscope slides and use a microscope.
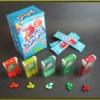
Adherence to HIV Treatment
Source Institutions
In this activity, learners simulate taking HIV antiretroviral drugs by using Tic Tac mints and Kool-Aid packets.

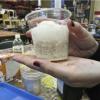
Mold Growth
Source Institutions
In this activity learners observe mold growth on different types of bread by measuring and recording the growth rate.
Starburst® Graph
Source Institutions
In this activity, learners use Starburst® candy to sort, classify, compare, and graph. Learners grab a handful of one-inch candy squares, sort them by color, graph the candy, and discuss the results.

Build a Big Wheel
Source Institutions
In this activity, learners explore how engineers have developed big wheels or Ferris wheels.
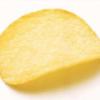
Ship the Chip
Source Institutions
In this activity, learners explore engineering package designs that meet the needs of safely shipping a product.
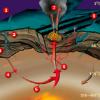
Candy Chemosynthesis
Source Institutions
In this activity, groups of learners work together to create edible models of chemicals involved in autotrophic nutrition.
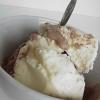
We all Scream for Ice Cream
Source Institutions
In this activity, learners observe how salinity affects the freezing point of water by making and enjoying ice cream.

Multi-Variable Relations: Stressed to the Breaking Point
Source Institutions
In this math lesson, learners explore the relationship between the thickness of a spaghetti bridge, the length of the bridge, and the amount of weight that can be supported by the bridge.
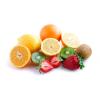
Pennies for Pits
Source Institutions
In this math lesson, learners use fruit to learn about proportions and percentages. Learners compare the weights of the edible and non-edible portions of fruit.
Breakfast Sweets
Source Institutions
In this math activity, learners guess which cereals contain the most sugar. Learners use the nutrition labels on the cereal boxes to find the cereal with the least amount of sugar.
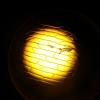
Hot & Cold
Source Institutions
In this activity, learners experiment with hydrogen peroxide, vinegar, yeast, and baking soda to produce hot and cold reactions. Use this activity to demonstrate exothermic and endothermic reactions.

Statistics: Something Fishy
Source Institutions
In this math lesson, learners apply the concepts of ratio and proportion to the capture-recapture statistical procedure.