Search Results
Showing results 1 to 5 of 5
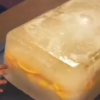
Frozen Fruit
Source Institutions
In this "Sid the Science Kid" activity from Episode 108: My Ice Pops, learners observe reversible change while thinking about ways to make ice melt.

Multi-Variable Relations: Stressed to the Breaking Point
Source Institutions
In this math lesson, learners explore the relationship between the thickness of a spaghetti bridge, the length of the bridge, and the amount of weight that can be supported by the bridge.

Exponential Models: Rhinos and M&M’s ®
Source Institutions
In this math lesson, learners model exponential decay and exponential growth using M&M's, paper folding, and African rhino population data.

Statistics: Something Fishy
Source Institutions
In this math lesson, learners apply the concepts of ratio and proportion to the capture-recapture statistical procedure.
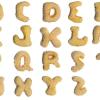
Computation and Estimation: Alphabits
Source Institutions
In this math lesson, learners apply the concepts of ratios and percentages to the distribution of letters contained in a box of Alphabits® cereal.