Search Results
Showing results 1 to 18 of 18
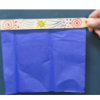
Draft Detectives
Source Institutions
In this two part activity, learners become draft detectives by constructing their own draft catchers to detect drafts around windows or doors.
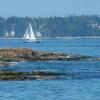
Why Doesn’t the Ocean Freeze?
Source Institutions
In this activity, learners explore how salt water freezes in comparison to fresh water.

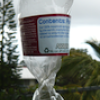
It's a Gas, Man
Source Institutions
In this activity, learners discover if carbon dioxide has an effect on temperature.
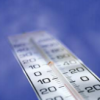
Crunch Time
Source Institutions
In this quick and easy activity and/or demonstration, learners use two empty 2-liter bottles and hot tap water to illustrate the effect of heat on pressure.
Weather Stations: Temperature and Pressure
Source Institutions
In this activity, learners discover the relationship between temperature and pressure in the lower atmospheres of Jupiter and Earth.
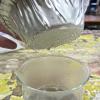
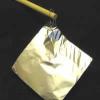
Weather Stations: Phase Change
Source Institutions
In this activity, learners observe the water cycle in action! Water vapor in a tumbler condenses on chilled aluminum foil — producing the liquid form of water familiar to us as rain and dew.

Avogadro's Bubbly Adventure
Source Institutions
In this activity on page 7 of the PDF, learners investigate the solubility of gas in water at different temperatures. This experiment will help learners determine if temperature affects solubility.
Wonderful Weather
Source Institutions
In this activity, learners conduct three experiments to examine temperature, the different stages of the water cycle, and how convection creates wind.
Differing Densities: Fresh and Salt Water
Source Institutions
In this activity, learners visualize the differences in water density and relate this to the potential consequences of increased glacial melting.

Chocolate (Sea Floor) Lava
Source Institutions
In this edible experiment, learners pour "Magic Shell" chocolate into a glass of cold water. They'll observe as pillow shaped structures form, which resemble lavas on the sea floor.
The Return of El Nino
Source Institutions
In this activity related to climate change and data analysis, learners examine temperature and precipitation data to determine if climate variations are due to El Niño.

That Sinking Feeling
Source Institutions
In this quick activity, learners observe how salinity and temperature affect the density of water, to better understand the Great Ocean Conveyor.
Make Your Own Deep-Sea Vent
Source Institutions
In this activity, learners make a model of the hot water of a deep sea vent in the cold water of the ocean to learn about one of the ocean's most amazing and bizarre underwater habitats.
How Greenhouse Gases Absorb Heat
Source Institutions
Learners observe two model atmospheres -- one with normal atmospheric composition and another with an elevated concentration of carbon dioxide.

Drawing Conclusions
Source Institutions
In this weather forecasting activity, learners determine the location of cold and warm fronts on weather plot maps.
Weather Stations: Winds
Source Institutions
In this activity, learners use a toaster to generate wind and compare the appliance's heat source to Jupiter's own hot interior. Learners discover that convection drives wind on Jupiter and on Earth.
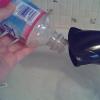
Air Pressure
Source Institutions
In this experiment, learners use a blow dryer and water bottle to observe and record changes in air pressure caused by changes in temperature.

Heat Capacity: Can't Take the Heat?
Source Institutions
Why is ocean water sometimes the warmest when the average daily air temperature starts to drop? In this activity, learners explore the differing heat capacities of water and air using real data.