Search Results
Showing results 181 to 200 of 330
Sharks: Taking a Bite Out of The Myth
Source Institutions
In this activity, learners will explore trends in shark populations using shark landing data from the National Marine Fisheries Service.
Statistics: Creature Features
Source Institutions
In this math activity, learners collect, organize, and analyze a set of data related to types of animals in the temperate forest.

Zoo Calendar
Source Institutions
Use the Zoo Calendar (page 1 of PDF) to involve learners in interdisciplinary, whole language, and writing activities about ecological concepts.
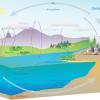
Water, Water Everywhere
Source Institutions
In this activity, learners estimate how much water they think can be found in various locations on the Earth in all its states (solid, liquid, and gas) to discover the different water ratios in the Ea
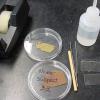
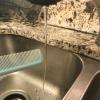
Composting: A Scientific Investigation
Source Institutions
In this activity, learners conduct a scientific investigation involving decomposition and discover that the life cycle of trash is affected by its organic or inorganic nature.
Inverted Foucault Pendulum
Source Institutions
In this demonstration, learners explore a variation of a Foucault pendulum, but upside down.
Crime Scene Investigation (CSI) with Powdery Mildew Fungi
Source Institutions
This exercise can be used to stimulate the investigative nature of learners as they use forensic plant pathology techniques to prove the learners' innocence in a mock murder investigation.
The Carbon Cycle and its Role in Climate Change: Activity 1
Source Institutions
In this activity (on page 1), learners role play as atoms to explore how atoms can be rearranged to make different materials.
Earth Walk
Source Institutions
In this hands-on and feet-on excursion, learners take a science walk to visualize the planet's immense size and numerous structures, without the usual scale and ratio dimensions found in most textbook
Static Water
Source Institutions
In this activity, learners will use static elecricity to bend a stream of water without touching it. Learners will explore physics and cause and effect through this activity.
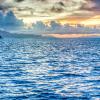
Mountains in the Sea
Source Institutions
In this 6-7 day investigation, learners begin with an introduction to seamounts that are present in the Gulf of Alaska.
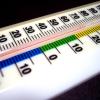
Canned Heat
Source Institutions
In this activity, learners explore how light and dark colored objects absorb the Sun's radiations at different rates.
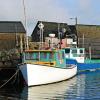
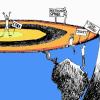
Sustainable Fishing
Source Institutions
In this activity, learners use a model for how fishing affects marine life populations, and will construct explanations for one of the reasons why fish populations are declining.
Build a Borneo Glider
Source Institutions
In this inquiry-based activity, learners investigate the basic forces of flight as they construct their own paper glider that represents a rainforest creature from Borneo (large, tropical island in So
Personal Time Line
Source Institutions
In this activity, learners work in groups to create a time line representing significant moments in their lives.
The Blue Crab's Chesapeake Journey
Source Institutions
In this data collection activity about crabs, learners use data from the Virginia Institute of Marine Science (VIMS) trawl survey to determine the areas of the Chesapeake Bay that are being used by bl
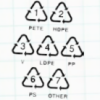
Sink or Swim?
Source Institutions
In this activity, learners identify different plastics in a mystery bag. Learners discover that plastics are classified #1 through #7.
Waves and Tides
Source Institutions
In this 7-10 day investigation, learners develop an understanding of waves and tides and their motion through discussion, demonstration, and hands-on activities.
Tree Growth Investigation
Source Institutions
This activity (located on page 3 of the PDF under GPS: Temperate Rain Forest Activity) is a full inquiry investigation into tree growth rates.

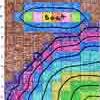
The Daily Ups and Downs
Source Institutions
In this activity, learners graph 48 hourly air temperatures from a local weather observation site and observe the diurnal temperature variations.