Search Results
Showing results 1 to 16 of 16

Good News: We're on the Rise!
Learners build a simple aneroid barometer to learn about changes in barometric pressure and weather forecasting. They observe their barometer and record data over a period of days.

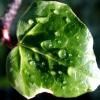
Acid Rain Effects
Learners conduct a simple experiment to model and explore the harmful effects of acid rain (vinegar) on living (green leaf and eggshell) and non-living (paper clip) objects.

It's a Gas, Man
Source Institutions
In this activity, learners discover if carbon dioxide has an effect on temperature.
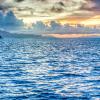
Sea State: Forecast Conditions at Sea
Source Institutions
In this oceanography and data collection activity, learners cast real time sea state conditions using buoys from NOAA's National Data Buoy Center.
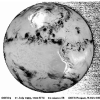
Do Cities Affect the Weather?
Source Institutions
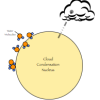
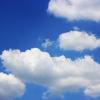
In this activity, learners explore clouds and how they form.

How can Clouds Help Keep the Air Warmer?
Source Institutions
In this activity, learners explore how air warms when it condenses water vapor or makes clouds.
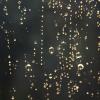
Weather Stations: Phase Change
Source Institutions
In this activity, learners observe the water cycle in action! Water vapor in a tumbler condenses on chilled aluminum foil — producing the liquid form of water familiar to us as rain and dew.
What is a “Convection Cell”?
Source Institutions
In this demonstration, learners can observe a number of small convection cells generated from a mixture of aluminum powder and silicon oil on a hot plate.
How does the Atmosphere keep the Earth Warmer?
Source Institutions
In this activity, learners simulate the energy transfer between the earth and space by using the light from a desk lamp desk lamp with an incandescent bulb and a stack of glass plates.
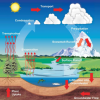
Carbon Cycle Poster
Source Institutions
In this activity, learners gain knowledge about how carbon moves through all four of the Earth’s major spheres (biosphere, hydrosphere, atmosphere, and lithosphere), and understand how humans influenc

The Daily Ups and Downs
Source Institutions
In this activity, learners graph 48 hourly air temperatures from a local weather observation site and observe the diurnal temperature variations.
Leaf it to Me
Source Institutions
In this activity, learners observe the effect of transpiration as water is moved from the ground to the atmosphere.

Drawing Conclusions
Source Institutions
In this weather forecasting activity, learners determine the location of cold and warm fronts on weather plot maps.
The Rain Man
Source Institutions
In this activity, learners observe the hydrologic cycle in action as water evaporates and condenses to form rain right before their eyes.
Water, Water Everywhere
Source Institutions
In this activity, learners estimate how much water they think can be found in various locations on the Earth in all its states (solid, liquid, and gas) to discover the different water ratios in the Ea
What is a "Model"?
Source Institutions
In this activity, learners simulate the behavior of the atmosphere.